This is an old revision of the document!
Table of Contents
This page is an incomplete draft that may only contain notes for later. The notes may be talking about the difficult parts of a topic while leaving out the easier parts. Assume that what you are reading may not be related to my real thoughts on a topic in any way and wait until the page is complete.
Then god seperated the state from the church
Secularization
![]()
Issues of their times
Jehovah's Witlesses
Christianity
Science
Woman
Overton Window
Malcolm X
We're not burning witches anymore, so we are secular
Misogyny
Incest
Ableism
Pedophilia
Arrogance
Man or Bear?
If Buying isn't Owning, then Pirating isn't Stealing
Slashed Zero
Self-Censoring
Society/
Statistics
Lying with Statistics
At least superficially, most humans claim that they can be persuaded by facts and numbers. Therefore, statistics are your weapon of choice when trying to convince other humans that you are right about something. Statistics compile the complexity of reality into easily digestible numbers that, ultimately, help assign a numerical value to things. For example, statistics can show us the change of GDP of a country over time, and we can try to interpret that based on the things we think influenced that change. This interpretation can be used to say things about the influences. For example, when rich countries with low birth rates allow immigrants in, this generally positively affects that country's GDP.
Statistics are numbers. Numbers themselves don't really mean a lot. And this is a problem: Numbers must be interpreted, and by presenting numbers in a certain way it is always - no matter the number or statistic - to nudge the reader into interpreting the numbers in whatever way you want them to interpret the numbers. Remember, all statistics can be expressed in a way to make it sound like it says the exact opposite of what it actually implies.
The Smoking Sprint Statistic
The most classical example of this is the smoking sprint statistic. It's a story of an empiricist measuring sprint speeds of a high school class. When sorting by time, it turned out that smokers tended to be the faster sprinters. What? Well, it turns out that smoking is disproportionately represented among males, and males also happen to be the faster sprinters on average (I use “male” and “female” here because is this about physiology and hormones). When accounted for by sex, a more reasonable distribution emerges with smoking males being slower on average than smoke-free males. Even smoking males tend to be faster than females on average, but within the group of females, smoking females on average still scored slower than those who did not smoke. All of us will be able to agree, though, that the tobacco industry will probably love the “raw” graph, and only the raw graph: “Smoking makes you a faster sprinter!”.
Crime: Absolute Numbers
A classic example in contemporary politics is the development of crime in relation to migration. Crime is a Statistical Inevitability. If your town is large enough, some amount of crime will always happen. As laid out in the page about statistical inevitability, things like crime should always be expressed as rates, because the raw number “x crimes committed” isn't useful on its own. If I tell you that our city had 5 reported break-ins this night, this could be a lot or very little, depending on whether it's a town of 10,000 or a metropolis of several million.
An easy way to lie about this is to use the raw number for shock factor. If a town of 10,000 gets 10,000 immigrants, it's now a town of 20,000. Do you see how this gives opportunity to lie about the numbers? It's so simple you'll even remember the necessary maths from school. Twice as much crime! The number of break-ins are going through the roof! 50% of our crime is committed by migrants! And that, even though migrants are actually committing the appropriate amount of crime and nothing about our statistics has actually changed. Using absolute numbers when relative numbers are more appropriate is a classic way to lie with statistics.
Crime: Relative Numbers

Look at this, left extremism is much worse than right extremism.
But, fear not, it works the other way around as well! Today is May 11, 2026 and I just stumbled over a fresh-off-the-press example of relative numbers being used to distort reality when using the absolute numbers was more appropriate. One of Germany's conservative parties is currently trying to make cooperation with the far right Nazi party palatable, and they do that with the standard method of pointing fingers at “the left”. So, the infographic goes as follows:
“Change of extremist crime in Bavaria:”, followed by a bar graph: “Islamism +6.5%”, “Right wing extremism +24.8%” and “Left wing extremism +135.7%”; “Source: Federal Office of the Protection of the Constitution 2025”. Hmmm, I bet the constitution protection office wouldn't sign off on this static as such, but putting their name there anyway lends these numbers crecedence.
If you're not prepared, what follows from this statistic would be that left wing extremism is much worse than right wing extremism. They're completely out of control!
Well, no, they're not going out of control. I find this chart to be weak in general because even with at least a little bit of life experience you'd recognize that the normal growth numbers for public policy things like crime generally moves in comparatively small numbers. If your numbers explode like this, this would typically raise questions about your methodology or your interpretation. For endemic types of crime, +6.5% is a natural amount of growth. Even when prompted due to certain events (like right now the Israel - Palestine situation) you can have spikes, but 135.7% is basically a number you just do not see. The reason for this is that left wing crime is not (or at least used to be) not endemic. Even the +24.8% for right wing extremism could be within the margin for endemic right wing extremism, the reason we have such an explosive development in left wing extremism is because it is/was NOT endemic. It basically wasn't a thing before and it's now because of Israel - Palestine that we see movement on that front. And of course, if there's only been very little of a thing before, spikes like these can easily happen when a conflict like that reaches a melting point. That's why spikes like 135.7% are possible, but then obviously don't say very much.
This graphic is a very smart use of relative numbers to distort the perception of the actual reality that was measured. The actual rates are still lying underneath. Left wing extremism used to be not represented, now there are roughly as many left wing extremist cases as there are right wing extremist cases (per capita). One other things this graph fails to mention is the type of crime typically committed. Right wing extremism is often targeted at individuals and frequently sees bodily injury. Left wing extremism expresses itself in vandalism and the destruction of property, not people (mostly1)).
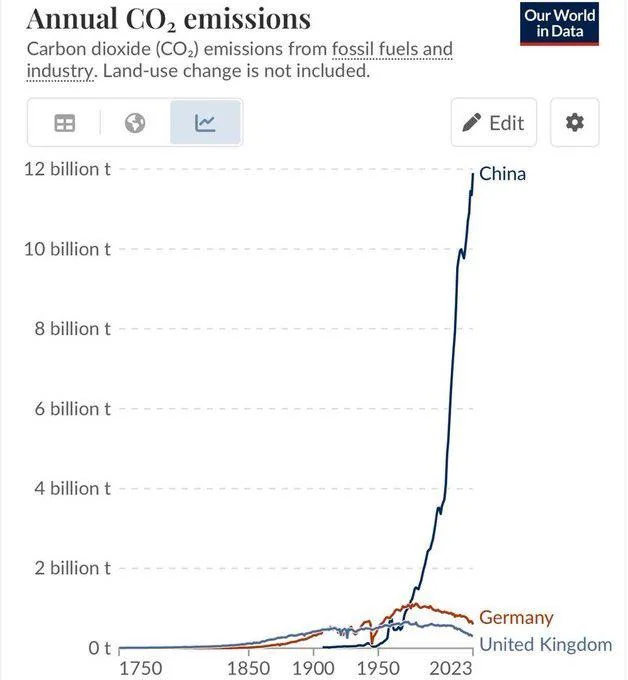
Climate Change: Absolute Numbers
Another graphic I stumbled over is the amount of CO2 emissions per country. If you understood the situation with crime, this one should be pretty easy to read as well. The argument here is that there is no point in western countries to go carbon neutral if China won't. Well, no, these are absolute numbers. China hosts more than a third of the world's population. More civies means more consumption means more emissions. Additionally, China also hosts the world's largest industry. Most of our stuff comes from there because it is cheaper to import from China than to manufacture locally. China doesn't just produce for itself, it produces most things for most of the world.
So, more industry means more emissions. If you adjust this graph for per capita and trade, this is the result:
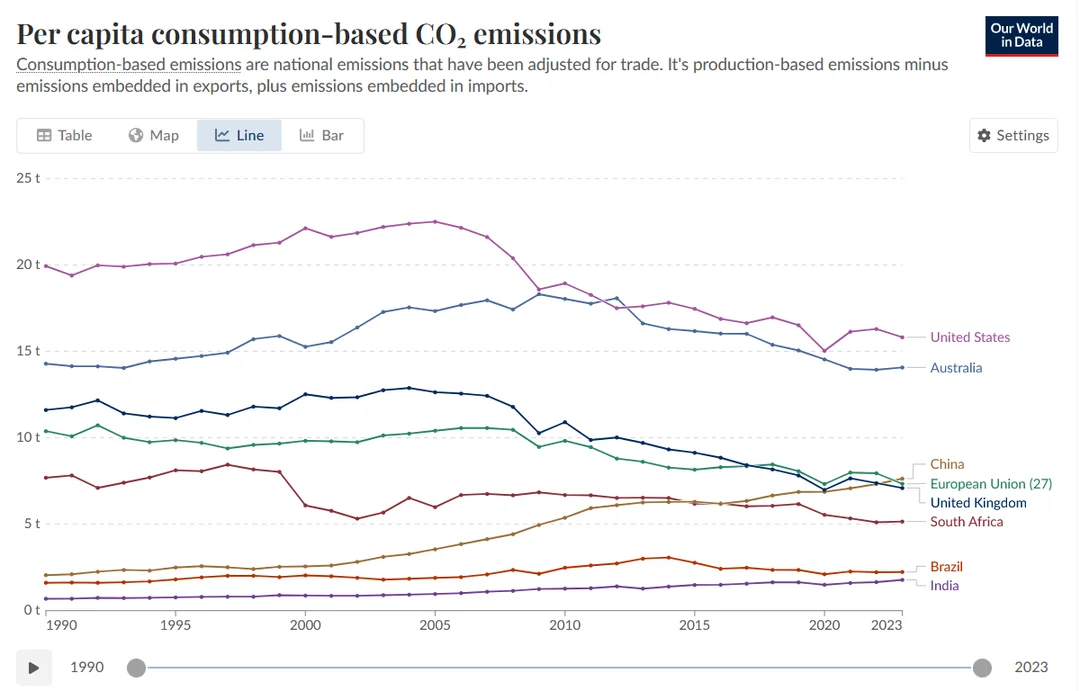
This is not to exculpate China from its increased responsibility in getting to net zero. If all our emissions are imported, it is still China from which these emissions are imported. However, it means there are things we can do about this. The simplest solution would be to stop importing. A more involved solution could be some kind of treaty with China wherein we pay more to China for our imports but China uses the extra money to go to net zero. There are all kinds of possible ideas here. But as far as these statistics are concerned and the way they are used to lie about our reality, it is wrong that we can't do anything about China's emissions, or that China isn't doing anything about its emissions. They're not just releasing uncontrolled amounts of CO2. The reality of China's emissions is that they are roughly on par with the rest of the developed world (except for Australia).